Related to Figures in Probability and Statistical Inference
Bivariate Normal Distribution

Bivariate Normal Distribution

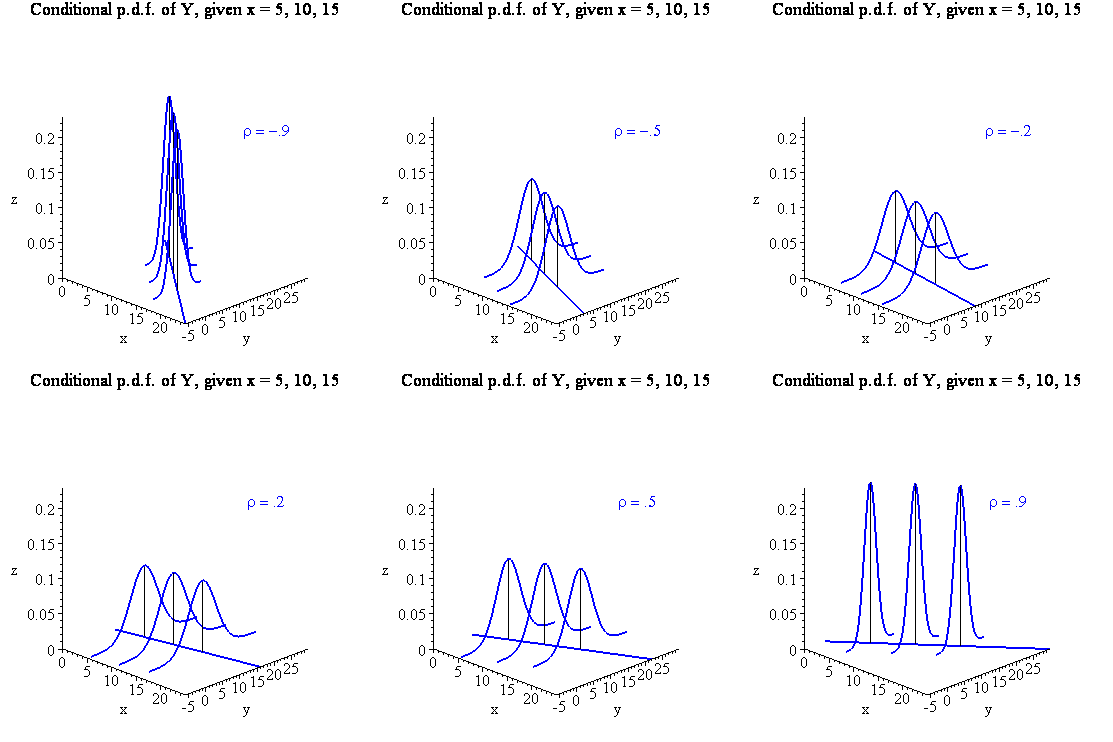
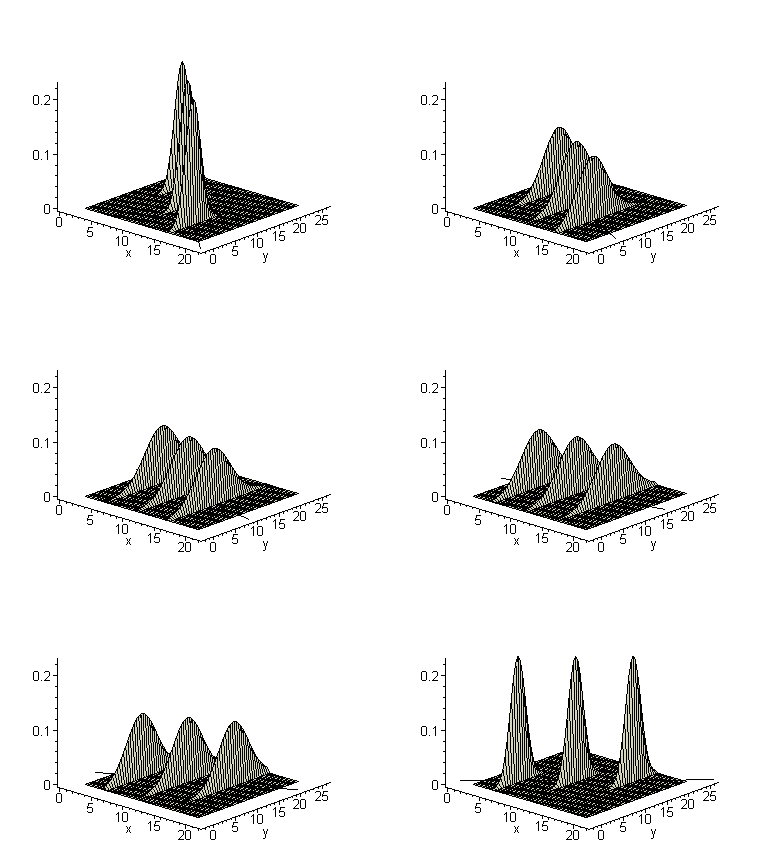
| Figure 5.6-1:
Conditional p.d.f.s of Y, given x = 5, 10, 15, for r = -0.9, -0.8, ..., 0.9 |
 |
| Figure 5.6-1:
Conditional p.d.f.s of Y, given x = 5, 10, 15, for r = -0.9, -0.8, ..., 0.9 |
 |
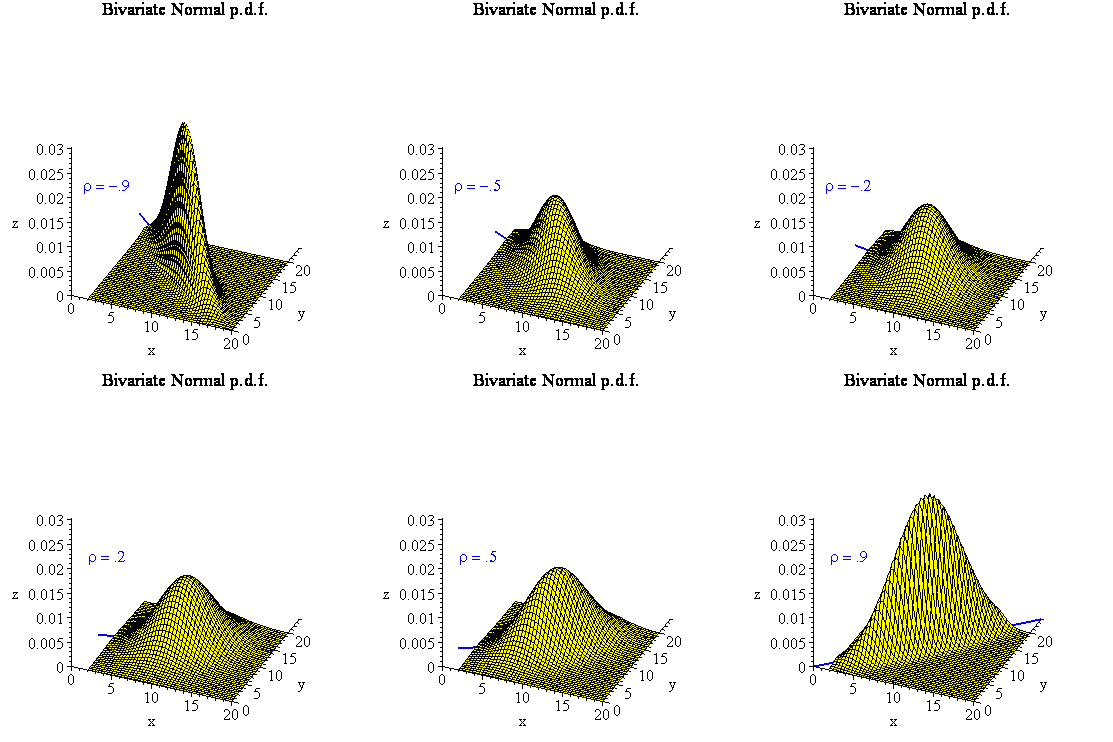
| Figure 5.6-2:
Bivariate normal p.d.f.s for r = -0.9, -0.8, ..., 0.9 |
 |
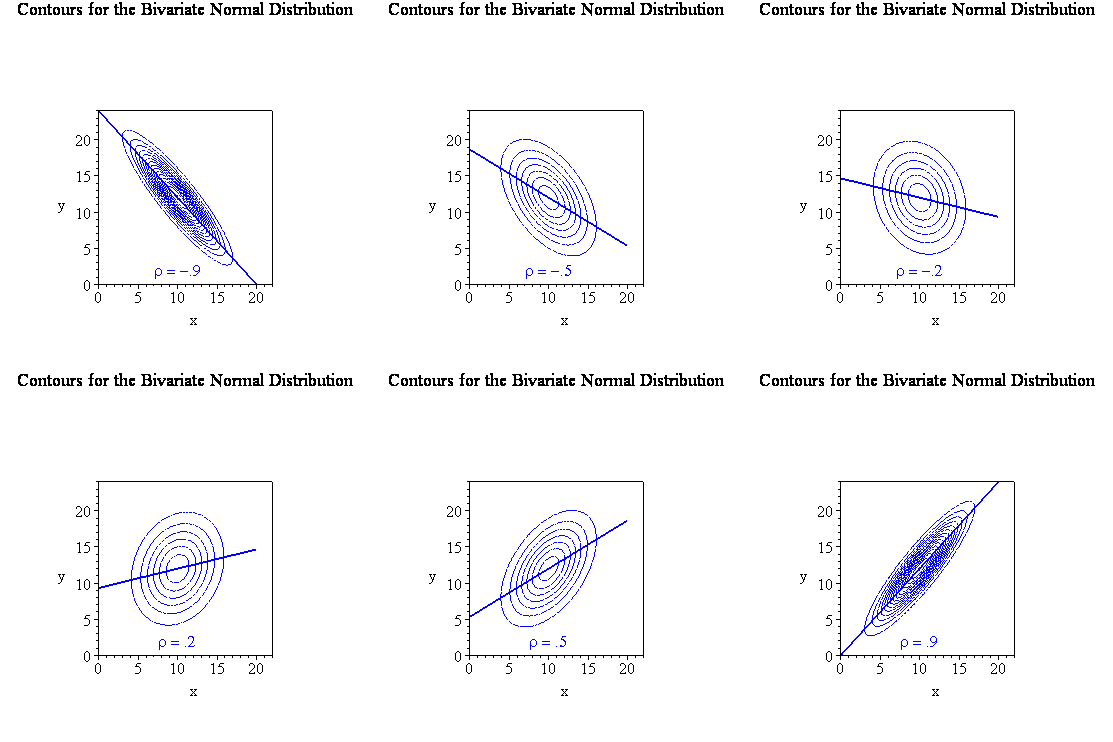
| Figure 5.6-3: Contours
for
the bivariate normal p.d.f.s for r = -0.9, -0.8, ..., 0.9 |
 |